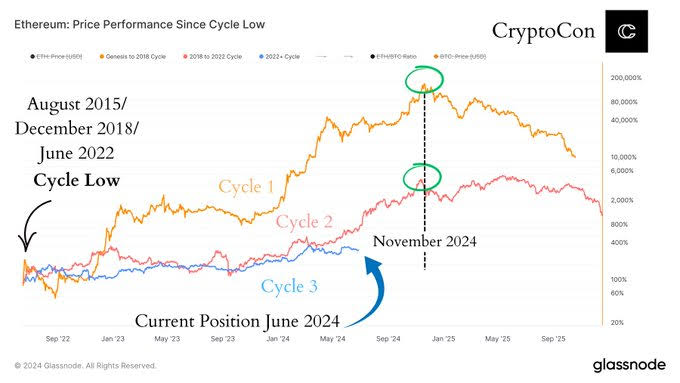
Ethereum Market Insights: Cyclical Trends and Current Sentiment
Recent analysis from the expert known as ‘Master Kenobi’ highlights that the ETH/BTC trading pair often declines following a Bitcoin halving event. Historical data shows that trend reversals tend to occur between 168 and 224 days after a halving. Given that it’s currently about 150 days post-halving, a shift in trend could be approaching.
Kenobi stresses that Ethereum’s fundamental value remains strong. He attributes the recent drop in ETH’s price to market-induced fear and uncertainty, which may be intentionally driving prices down to prompt panic selling. Despite these short-term pressures, the core strength of Ethereum remains solid, and the current decline might just be a strategy to drive out less confident investors.
Further context from Galaxy Trading on September 16 reveals that sentiment towards Ethereum is at its lowest since 2017. Such extreme negativity could signal a potential rebound. Historically, very low sentiment levels have often been followed by significant market reversals. Galaxy Trading suggests that despite the prevailing gloom, this situation could represent a buying opportunity rather than indicating any fundamental issues with Ethereum.
In essence, while Ethereum is facing notable downward pressure and extremely low sentiment, historical trends and the underlying strength of the asset suggest that a market reversal might be near. Investors might want to take these factors into account when making decisions in the current market climate.


